Published on Mar 14, 2017
News from the front of creating a global urban metabolism dataset. The first data points had been added to the dataset and we share here some first impressions on the process. As you might remember from our last post, this is our second Stakeholders Initiative and we aim to construct one centralized, open dataset with most of data points from a representative sample of urban metabolism studies, linked to the original source and indexed by year and data type. By doing this, the Metabolism of Cities expect to get a better understanding into the work that has been done globally, what are the consistencies, patterns and what needs further work.
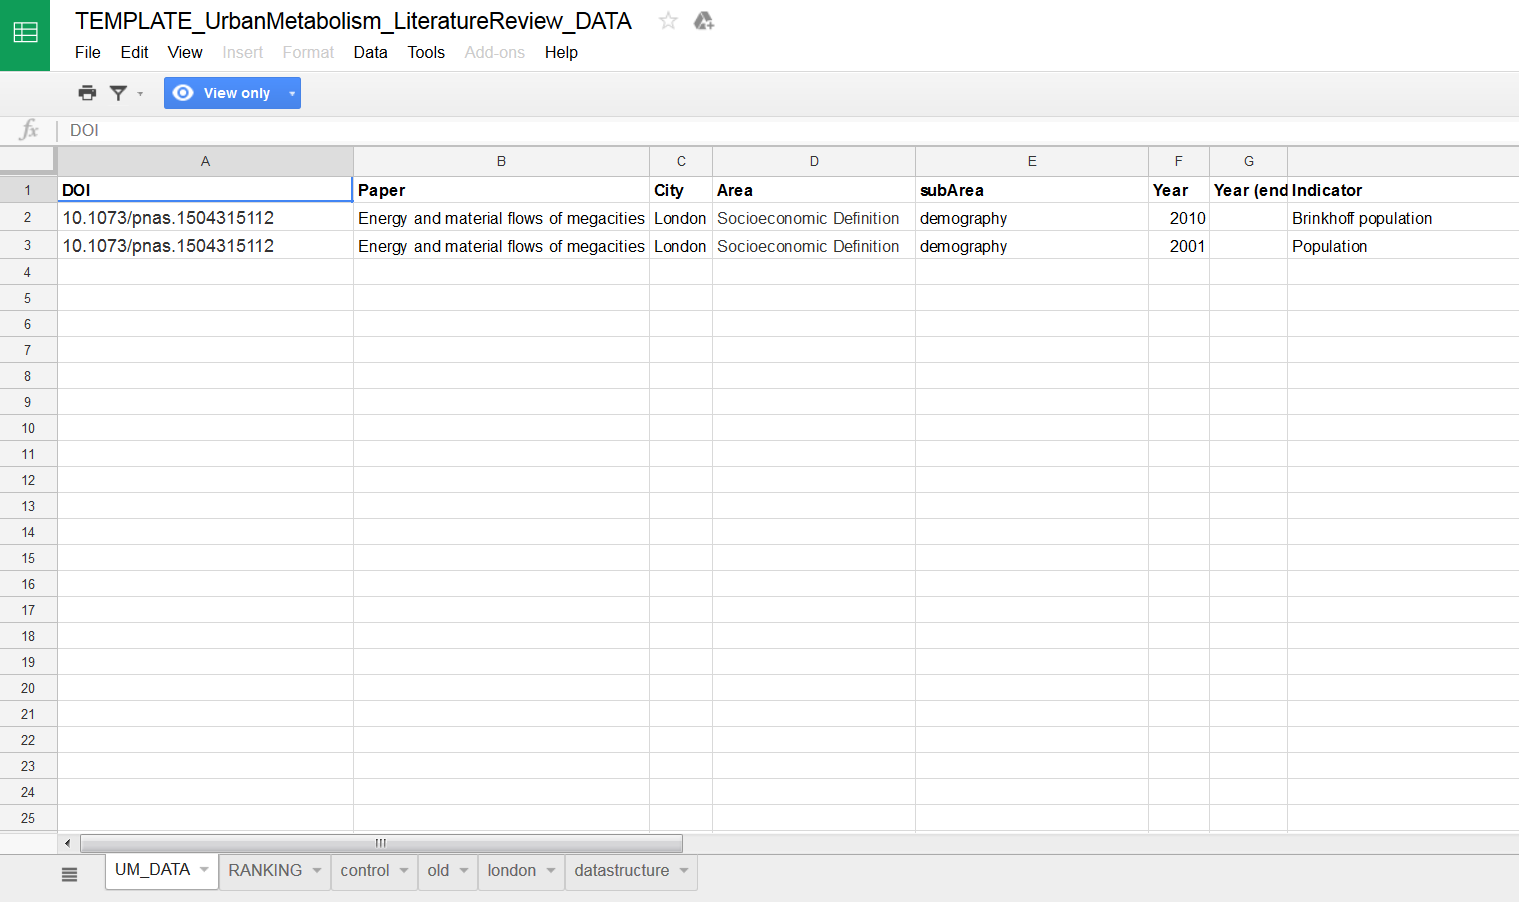
Most of the data is available in the form of excel tables in the supplementary information of the publications. This reinforces our claim for a necessity of a centralized and relational database of urban metabolism, given that excel files can cause many unintended errors in data managing. On top of that, data points could come in almost any possible form, units and from any possible method. For that, we decided to create one row for each datapoint. With columns describing the city, the publication, the year, the variable, the unit. This format - available here (and see below) - make the dataset generic enough to receive any type of data and easily reshapable. The drawbacks of this format is that it implies a lot of information going into the observations column - basically, anything that don’t fit in its very simple structure.
With the first figures up in our database, we can sketch some perceptions. The first remarkable finding is the scarcity of the data. A lot of publication could not find information for material flows or have population with 10 year intervals. Furthermore, as expected, there is a lack of consistency in the data. Some of the most prominent inconsistencies are listed below:
Fundamental differences in the data collection methods. Even within the same publication, it is possible to find data points coming from surveys, measurement tools and scaled from national level. This imposes a big problem in data comparison.
Publications are scattered across time due to expected research constrains but also to the publication schedule of cities or countries.
Massive methodological differences and aims can be found. What is included, for example, under the energy consumption indicator can vary greatly from one publication to another. This makes data comparisons very uncertain.
In relation to the methodological differences, we should agree upon how to account for the indicators, or have a good description of them. Some methods, however, should be avoided if we are about to come up with metabolic studies that corresponds to the state of the art knowledge on urban dynamics. Scaling data from the national level based on the population, for example, can be a fundamental mistake given the non-linear scaling of most urban features in relation to the population.
Another step further would be to find a way of going beyond year-based statistics. Those offer a coarse-grained temporal description of the metabolism, forcing conclusions to the same level of aggregation. The new wave of urban big data could be adopted by the urban metabolism community to have better spatial and temporal description of the processes. This could include social media data, retail data (from stores or citizens) or smart meters.
The process of collecting data from urban metabolism publication have been pretty much enlightening and new ideas are emerging. As a result, we need everyone's help! Any researcher, professor, student, or urban metabolism enthusiast can help us in this work. Combing through publications is time-consuming work and we can use all the help we can get. So if you are keen to contribute, be sure to get in touch with the Metabolism of Cities!
joao.meirelles@epfl.ch
Published on Sep 26, 2018
Published on Jun 25, 2017
Published on Mar 14, 2017
Published on Feb 06, 2017
Published on Jan 07, 2017
Published on Jan 01, 2017
Published on Dec 09, 2016
Published on Nov 01, 2016
Published on Oct 01, 2016
Published on Sep 22, 2016