Published on Jan 01, 2017
The concept of urban metabolism is evolving into a series of relatively distinct research frameworks among various disciplines, with varying definitions, theories, models, scales, aims and visualizations. As a result, it is important to further understand how different types of interdisciplinary fields visualize the urban metabolism in cities through design (color palettes, patterns, style, methodology, indicators, scale, fonts...). There are many ways to visualize the urban metabolism in cities. Moreover, there is a challenge to design a map or diagram that is clear and appealing at the same time, and that captures the full extent of a data set.
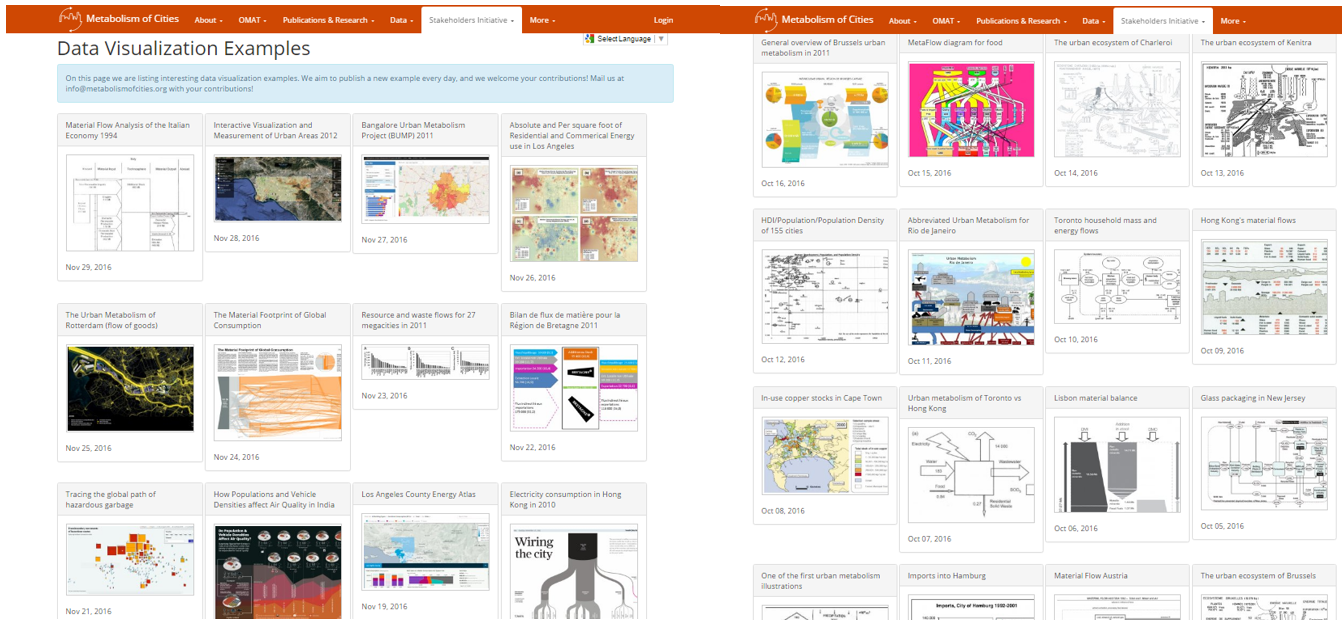
The Metabolism of Cities (MOC) recently launched the “Visualization Project" (Link) under the Metabolism of Cities Stakeholder Initiative which focuses on various activities pertaining to further the knowledge and discipline on the understanding of interdisciplinary pathways on urban metabolism research. From October 1, 2016 to December 31, 2016 visualizations were added on a daily basis with a total of 92 visualizations. Visualizations (ie. Sankey) varied by characterization, style, design, input-output models, scale, colors, urban metabolism models, using an array of methodological tools from different scientist from all around the world. The purpose of the “Visualization Project” is to start conversations to fully develop understanding and consensus among the urban metabolism community.
Figure 1. Metabolism of Cities Visualization Project
Data Visualization Project Statistics
On January 20, 2017 a polling took place to allow urban metabolism professional and non professionals to vote for their 3 favorite visualizations. A total of 130 votes were casted on the search to find the best visualization on urban metabolism. The voting was composed of 35% women (45) and 65% men (85) from an array of countries around the world: Brazil, Italy, China, Turkey, Iran, Switzerland, Belgium, Australia, Ukraine, Algeria, Bosnia, France, United Kingdom, Austria, Spain, Portugal, Norway, United States of America and Others. Figure 2, illustrate the total number of participants by country and it can be shown that Belgium, Australia, United States of America and Other obtained the highest number of votes.
Figure 2. Total number of votes by country (N=130)
Figure 3. Total number of votes by gender
A total of 130 votes were composed of professionals and non professionals in the environmental and social sciences: Electronics, Information Technology and Computer Science; Agriculture, Biodiversity and Marine; Meteorology; Building, Architecture and Urban Planning; Architectural Engineering; Education; Chemical and Material Science; Geography, Transportation and Economics; Environmental Science and Ecology; Mathematics; Electrical Engineering; Mechanical Engineering and Other. Figure 4, demonstrate the Building, Architecture and Urban Planning professionals obtained the highest number of votes.
Figure 4. Total number of votes by interdisciplinary field
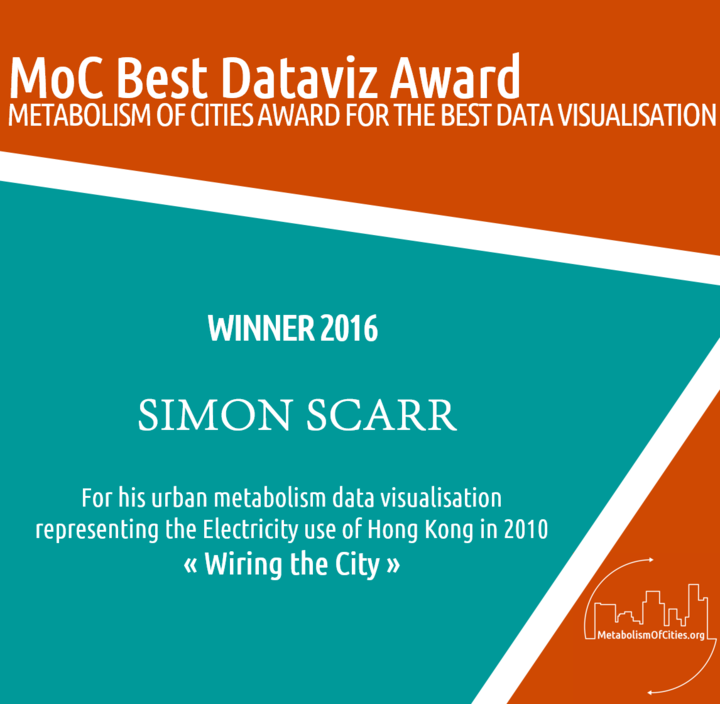
Data Visualization Project Winner
The First Edition of the Metabolism of Cities Stakeholder Initiative Data Visualization 2016 winner goes to the visualization titled, “Electricity consumption of Hong Kong in 2010” by designer Simon Scarr shown in Figure 5. The electricity consumption of Hong Kong, China inspired winning visualization obtained the highest number of votes from a total of 92 visualizations. The following professional and non professional interdisciplinary fields voted for the winning visualization, "Electricity consumption of Hong Kong in 2010." Voters ranged from Chemical and Material Science; Agriculture, Biodiversity and Marine; Building, Architecture and Urban Planning; Geography, Transportation and Economics, Environmental Science and Ecology, Mechanical Engineering and Other.
Figure 5. Electricity consumption of Hong Kong in 2010 (Simon Scarr, 2012)
The ‘Wiring the city’ address an educational display of the social behaviors of consumers in Hong Kong, China. Using a metaphorical portrayal of the city as a complex system through a wiring display of flows that interconnect with other flows.
“The government is mulling a revamp of electricity tariffs that would see those who use the most pay more. Consumption varies considerably across different sectors of the economy, and keeping us all cool remains the single biggest drain on the power grids.” -Simon Scarr
Mr. Scarr applied an artistic sankey diagram to distinguish the electricity flow characteristics from ‘Users’ and ‘Use’ using sub sectional flows based on the size and thickness of flows. The ‘Users’ are categorized by sector: residential, commercial, industrial and transport. It can be easily shown that the commercial sector show the highest flows of electricity consumption when compare to residential, industrial and transport sector. The visualization demonstrate a rich choice of color with low undertones to high vibrant palletes. Moreover, for Hong Kong to become more energy efficient through decision making this visualization provide an educational, simplistic and metaphorically fun portrayal of the city as a complex system. It can be argued that professionals face design uncertainty when developing urban metabolism visualizations from displaying values over a period of time or among items or groups, time needed to commit, choice of colors, city scale, methodological design, software/program application, indicators, drivers, number of data points displayed for each variable, font, text, style, interpretation, targeted audience, visibility, clarity, replicability and simplicity.
gabriela.fernandez@polimi.it
Published on Sep 26, 2018
Published on Jun 25, 2017
Published on Mar 14, 2017
Published on Feb 06, 2017
Published on Jan 07, 2017
Published on Jan 01, 2017
Published on Dec 09, 2016
Published on Nov 01, 2016
Published on Oct 01, 2016
Published on Sep 22, 2016